The onboarding flow for the FCX platform was seeing major drop-offs. The process had eight steps and spread across multiple pages, which many users found overwhelming. The goal was to simplify it, reduce friction, and improve overall conversion.
As the Product Designer, I collaborated with the Design Lead and stakeholders to re-evaluate what information was truly needed up front. I led the user research, redesigned the flow, and ensured the new experience made sense both for users and for our stakeholders. I also worked with front-end teams to test and refine mobile responsiveness to ensure our redesigned flow translated seamlessly into code and performed well across all devices. This collaboration was key to turning our ideas into a working experience that benefited both users and the business.
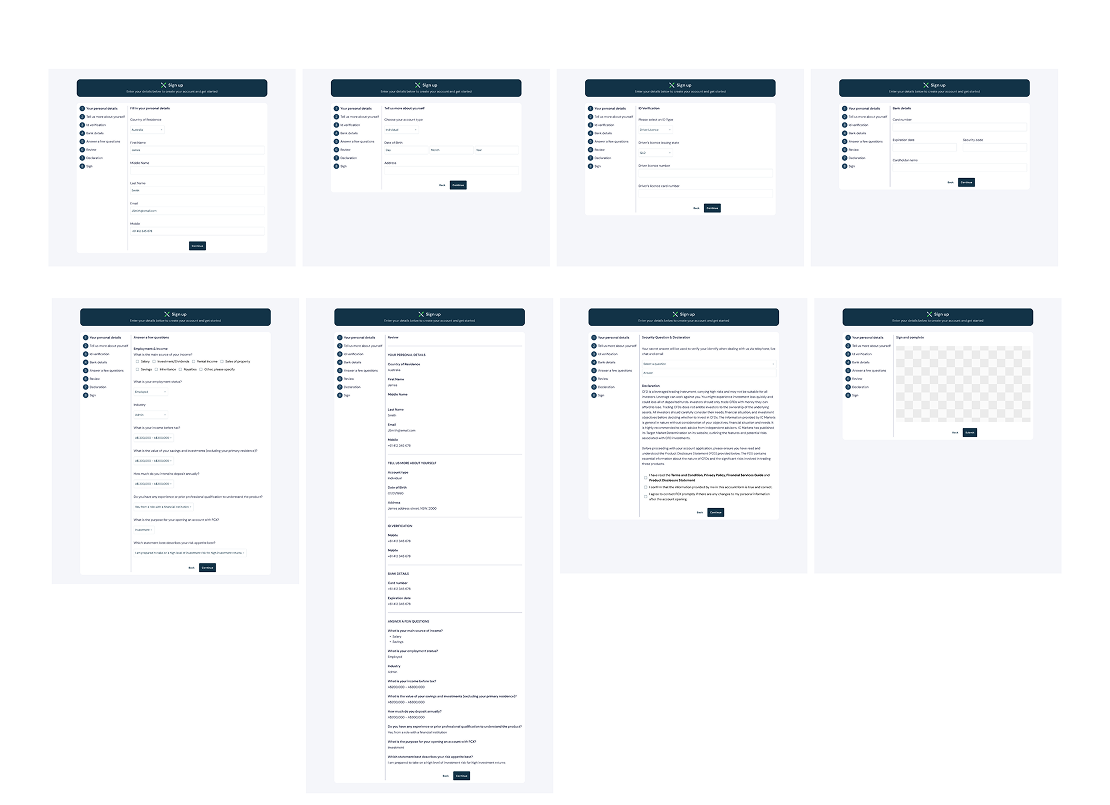
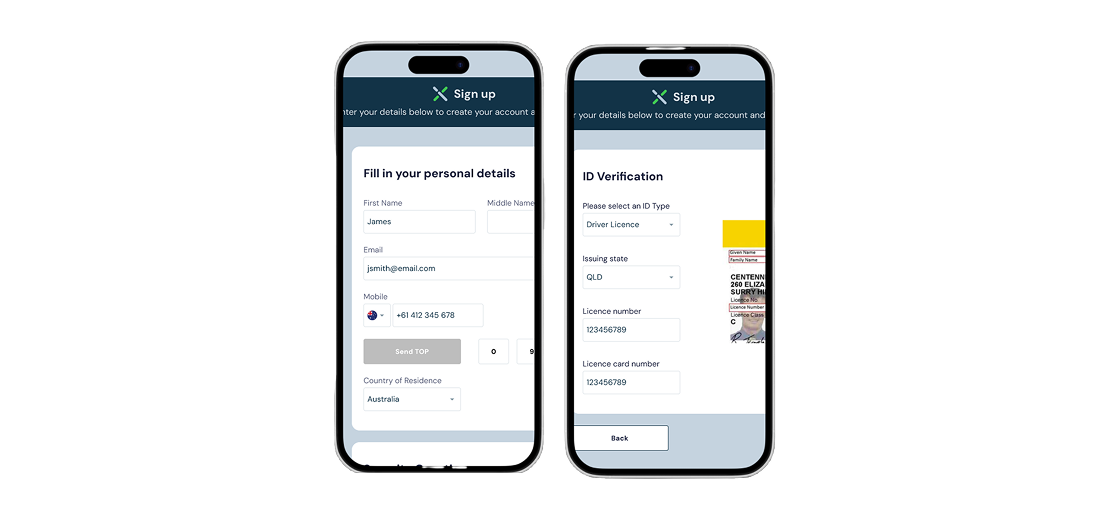
Our analytics revealed that users were abandoning the onboarding process at an alarming rate, particularly midway through the flow. The eight-step journey asked for too much information too soon, with little explanation of why the data was needed.
Original onboarding flow
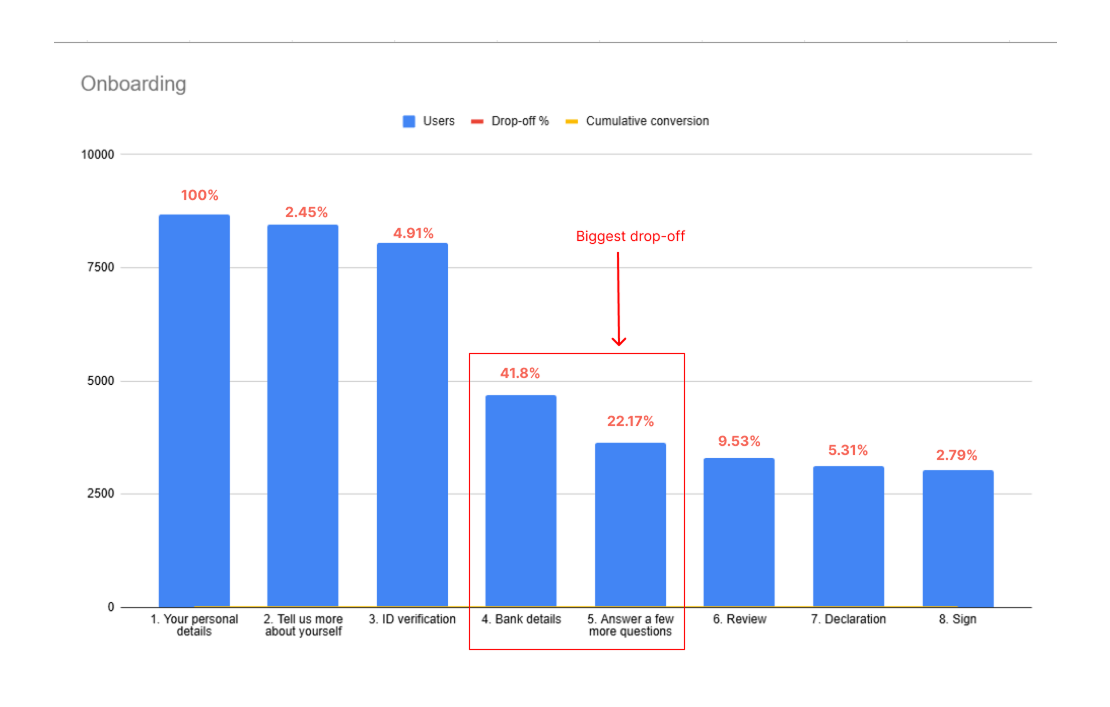
To uncover the root causes, I combined quantitative and qualitative research. On the quantitative side, I mapped drop-off points and funnel data, identifying exactly where abandonment was highest. On the qualitative side, I conducted user interviews, which revealed that the long forms and unclear copy were overwhelming. Together, these insights made it clear we were asking for too much too early.
WHAT DID WE LEARNT
To define success, we set clear goals before redesigning the flow. If we could deliver a shorter, clearer onboarding journey, we would consider the redesign a success.
Once we had a clear picture of where users were dropping off, I set up a meeting with key stakeholders (Product Owner and compliance team) to share what we’d learned. I walked them through the analytics and user feedback, showing exactly which steps were causing the most friction.
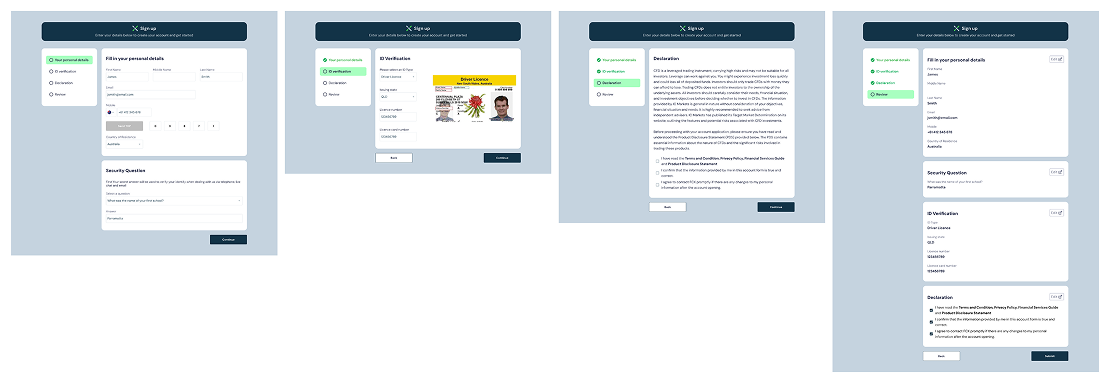
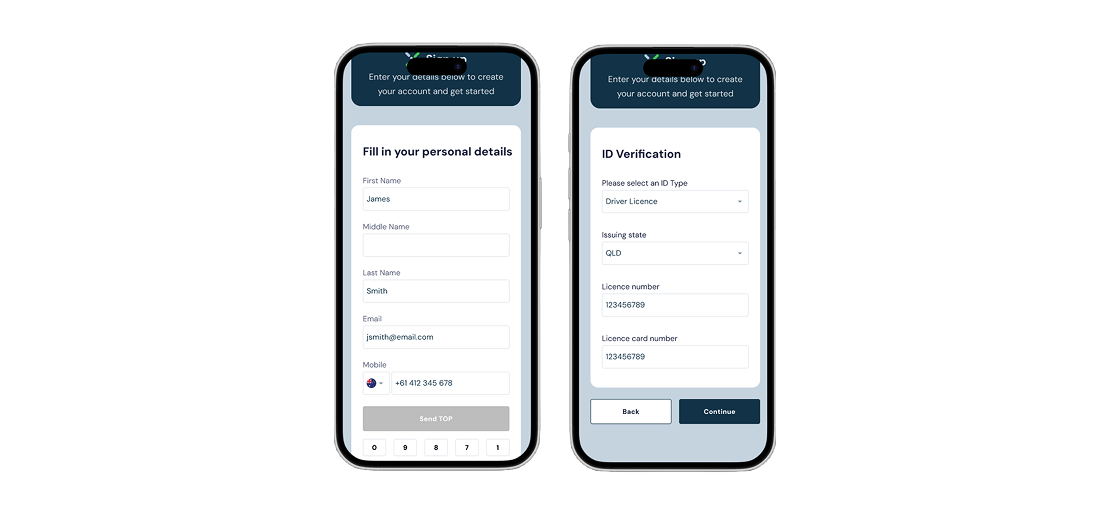
Using this data as a starting point, we worked together to decide which steps were essential and which could be removed or postponed. By explaining the reasoning behind each proposed change, I was able to get everyone on board with a much shorter flow. I then redesigned the onboarding journey, reducing it from eight steps to four pages, simplifying the language, and adding a clear progress tracker so users always knew where they were.
Redesigned flow
The changes paid off quickly. Sign-up conversion jumped by 35%, and onboarding time was cut nearly in half. Involving stakeholders early meant faster approval and smoother implementation, while the data-backed approach gave the whole team confidence that the redesign would work. The end result was a much more welcoming, efficient onboarding experience that helped new users start using FCX faster and with less frustration.
After launching the onboarding redesigned flow, we noticed that conversion rates on mobile devices were still lower than expected. Looking closer, we realised the mobile view wasn't full responsive. Even though the desktop experience had improved, mobile users were still struggling.
This project showed me how powerful data and research can be when redesigning an experience. By looking closely at the numbers and talking to users, we were able to see exactly where people were getting stuck and make changes that actually solved their problems.
If I could do it again, I'd focus on testing the mobile experience much earlier. Catching the responsiveness issues before launch would have saved time and made the rollout smoother. The whole experience reinforced an important lesson for me: simplify where you can, test early across all devices, and use evidence not assumptions to guide decisions.